The Question That Started It
One random day, I found myself wondering
How many times do I actually open ChatGPT, Claude, or Gemini in a day?
Turns out I had no answer to that question. All I could do was make a few guesses.
I just wanted a simple way to see how often I was visiting these sites. And since I enjoy building things and love web development, my immediate thought was:
Why not build something that tracks it?
So I Built a Tracker
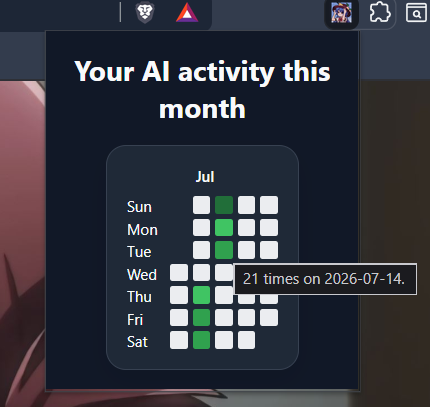
The extension after a few days of usage.
The idea was simple,
Every time I open:
- ChatGPT
- Claude
- Gemini
the extension keeps track of it
No accounts. No analytics dashboard. No complicated setup.
Just a small counter running quietly in the background, answering my question
The Fun Part: The Heatmap
I didn’t want another boring table.
So I stole my favorite UI pattern: GitHub’s contribution graph.

GitHub's contribution graph.
Each day becomes a square.
The more AI sites I open, the darker the square becomes.
After a few weeks, the graph starts revealing patterns that would be difficult to notice otherwise.
Building It
The stack is pretty simple:
- Chrome Extension (Manifest V3)
- Vue 3
- Chrome Storage API
Most of the challenge wasn’t coding.
It was deciding what should actually count as usage.
Why I Made It
Mostly curiosity.
I like measuring things.
Steps. Study hours. Coding streaks.
AI usage felt like another interesting metric.
Try It Out
If you’re curious about your own AI habits, give it a try.
You might discover that you’re opening ChatGPT a lot more often than you think.
- GitHub Repository: AI Usage Tracker
- Chrome Web Store: Someday